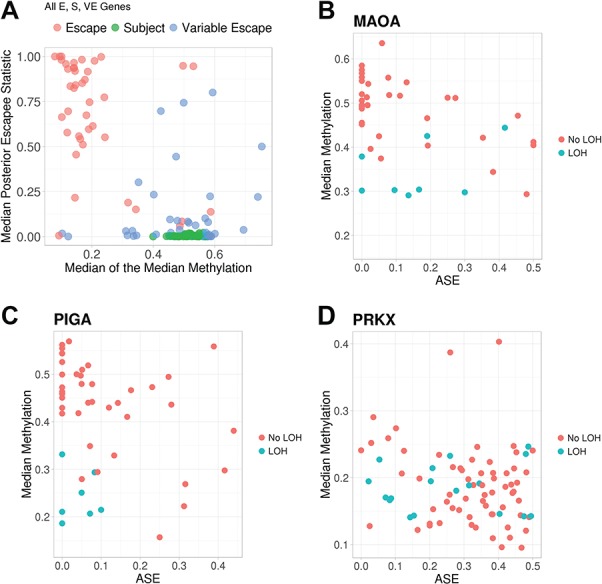
Figure 2.

Correlation between the promoter methylation and the probability of escape from XCI (A) and ASE (B–D) of the corresponding gene. (A) For each gene, the median of the posterior probability of escape across 99 tumor samples is plotted against the median across tumor samples of the median DNA methylation across the CpGs in the promoter. Colors indicate the prior literature escape status of each gene by Balaton et al. (escape from XCI, subject to XCI or variable escape). For each tumor, patterns of median DNA methylation across CpGs in the promoter are plotted by ASE of select individual genes: (B) MAOA and (C) PIGA, which are subject to XCI and (D) PRKX, which escapes from XCI. Colors indicate presence of LOH in the gene region for that particular tumor.
