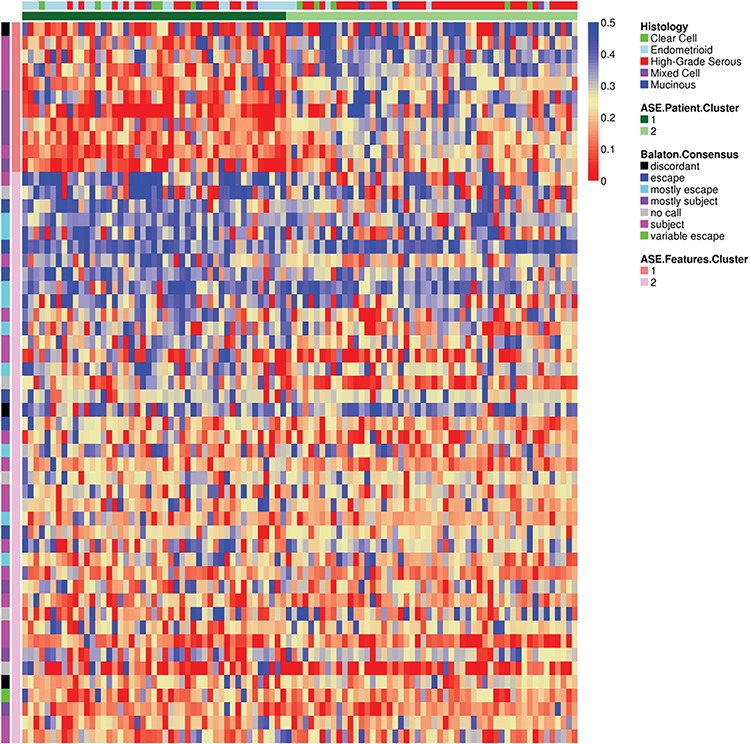
Figure 3.

XCI patterns across ovarian tumors after feature extraction. Heatmap of the adjusted ASE for X chromosome genes after feature extraction. Rows are genes, and columns are samples. Color legend indicates the proportion of ASE reads. Previously published escapee patterns for each gene and the feature clusters are plotted on the left, and the characteristics of each sample and the patient clusters are plotted at the top.
