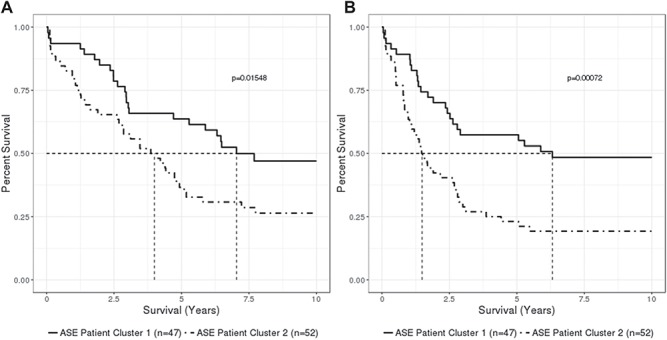
Figure 4.

Kaplan–Meier curves of 10 year overall survival (A) and time to disease recurrence or death (B) by patient XCI subgroup defined by adjusted ASE. Percent survival is plotted against time in years. Dashed lines indicate median survival time. P-values indicate differences in curves from the log-rank test.
