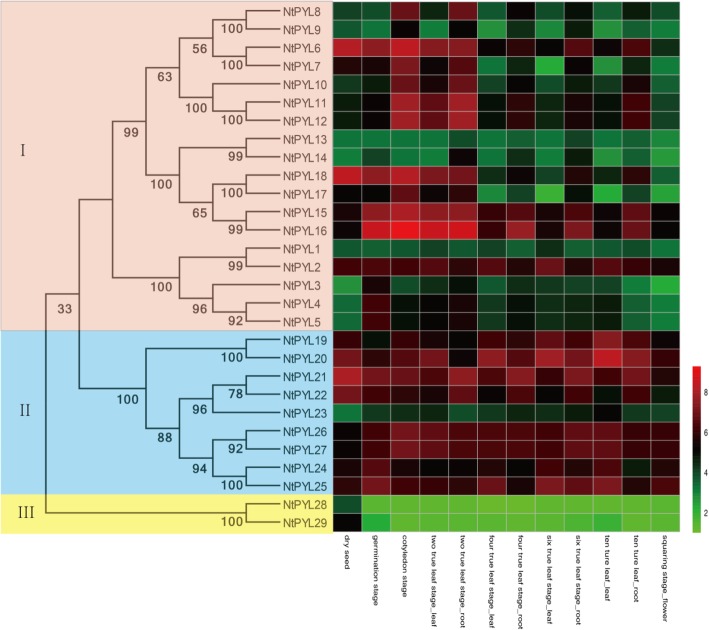
Fig. 6.
The expression profile of 29 NtPYLs in tissues at different developmental stages. The relative transcript abundances of 29 NtPYLs were examined via microarray and visualized as a heatmap. The gene expression profiles of NtPYLs in 12 different samples, including dry seeds, germination seeds, cotyledons, leaves from two-true leaf stage (labeled as two true leaf_leaf), roots from two-true leaf stage (two true leaf_root), leaves from four-true leaf stage (four true leaf_leaf), roots from four-true leaf stage (four true leaf_root), leaves from six-true leaf stage (six true leaf_leaf), roots from six-true leaf stage (six true leaf_root), leaves from 10-true leaf stage (ten ture leaf_leaf), roots from ten-true leaf stage ten ture leaf_root), and flowers at squaring stage (squaring stage_flower). The X axis is the samples in tissues at different developmental stages. The color scale represents Log2 expression values

