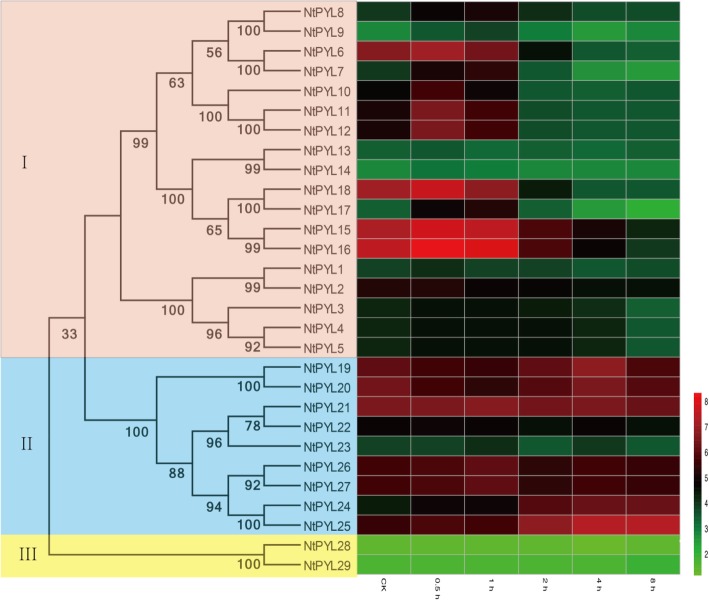
Fig. 7.
The expression profile of 29 NtPYLs in response to drought treatment. The relative transcript abundances of 29 NtPYLs were examined via microarray and visualized as a heatmap. The 6–7 weeks old Nicotiana tabacum seedings grown in the soil were treated by air dehydration. The X axis is represented for the indicated time after drought treatment. The color scale represents Log2 expression values

