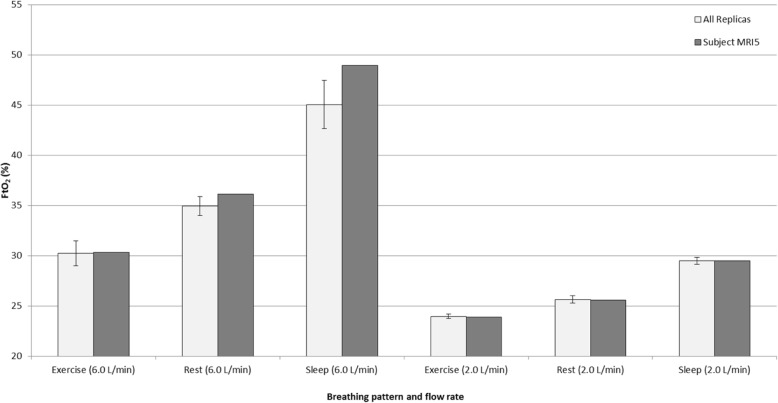
Fig. 2.
Comparison of FtO2 measured in nose-throat replica MRI5 vs. average data obtained from the larger set of 15 adult nose-throat replicas. Error bars denote one standard deviation. Exercise, Rest, and Sleep breathing patterns are described in Chen et al. [23]. Data labels ‘2.0 L/min’ and ‘6.0 L/min’ refer to tests performed with continuous oxygen delivery at the flow rate indicated

