
Fig. 2.
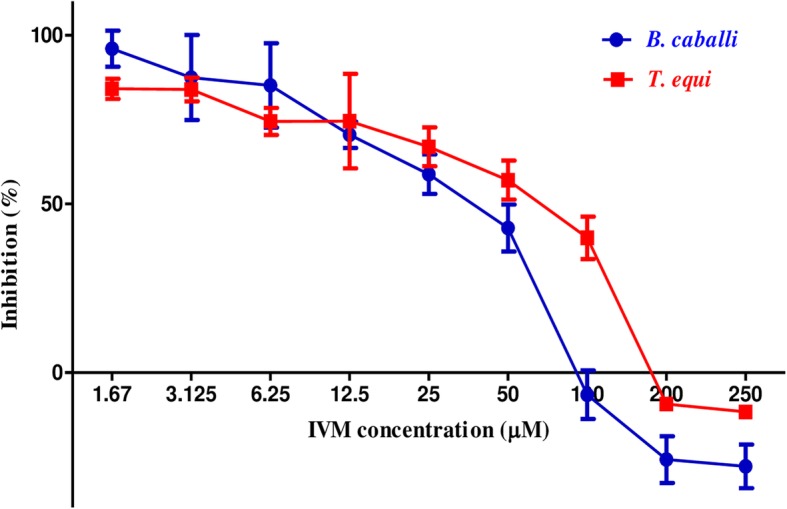
The dose-response curves of ivermectin against equine piroplasm parasites in vitro. The curve shows the correlation between relative fluorescence units (RFUs) and the log concentrations of IVM (μM) in B. caballi and T. equi treated with various concentrations of IVM. The result was determined by fluorescence assay after 96 h of incubation. The values obtained from three separate trials were used to determine the IC50s using nonlinear regression (curve fitting analysis) in GraphPadPrism software