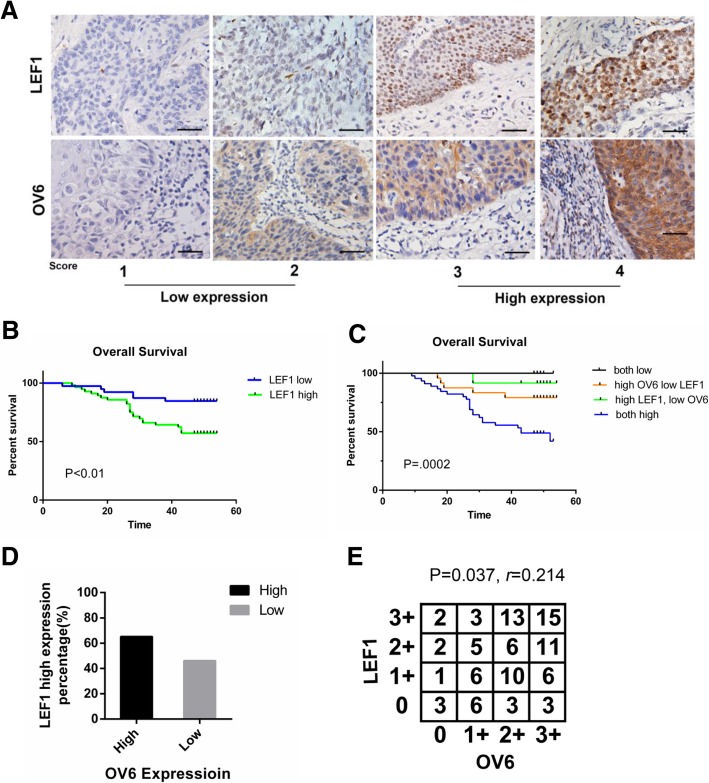
Fig. 1.
LEF1 and OV6 expression in ESCC tissues and its clinicopathological characteristics. a Immunochemistry analysis on expression of LEF1 and OV6. Representative staining intensity of LEF1 and OV6 represent different expression levels (scale bar = 100 μm). b Overall survival rate for patients with low LEF1 expression (blue line) and patients with high LEF1 expression (green line), P < 0.01. c The overall survival rates of 95 patients with ESCC were compared with different groups by Kaplan–Meier analysis, P = 0.0002. d The percentage of patients with high LEF1 staining was higher in the OV6-high group. e Correlation between expression levels of OCT4 and LEF1 in ESCC measured by spearman’s rank correlation analysis, Spearman r = 0.214, P = 0.037

