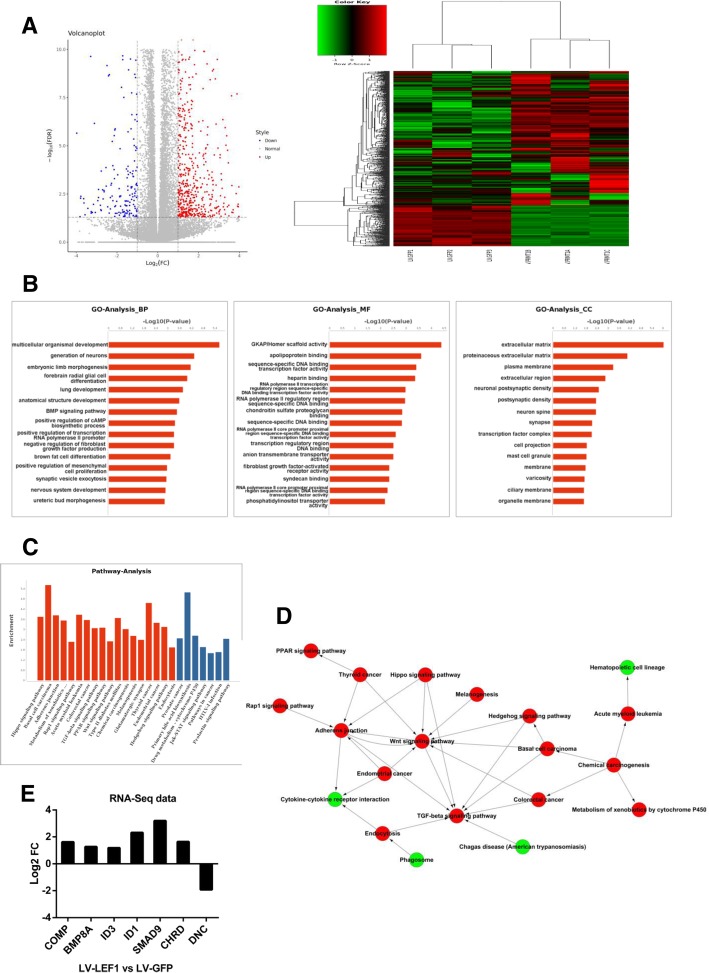
Fig. 5.
Overexpression of LEF1 promotes TGF-β signaling pathway. a Heatmap and volcano plot of differentially expressed transcripts. b, c Gene ontology (GO) analysis (b) and pathway analysis (c) based on all identified transcripts. P-value of GO analysis is listed for each category. P-value of pathway is colored in red (P < 0.05) and blue (0.05 < P < 0.1). d Pathway-act network of up-regulated (red) or down-regulated (green) pathways according to pathway database. e Gene expression fold change of TGF-β pathway from RNA-Seq data

