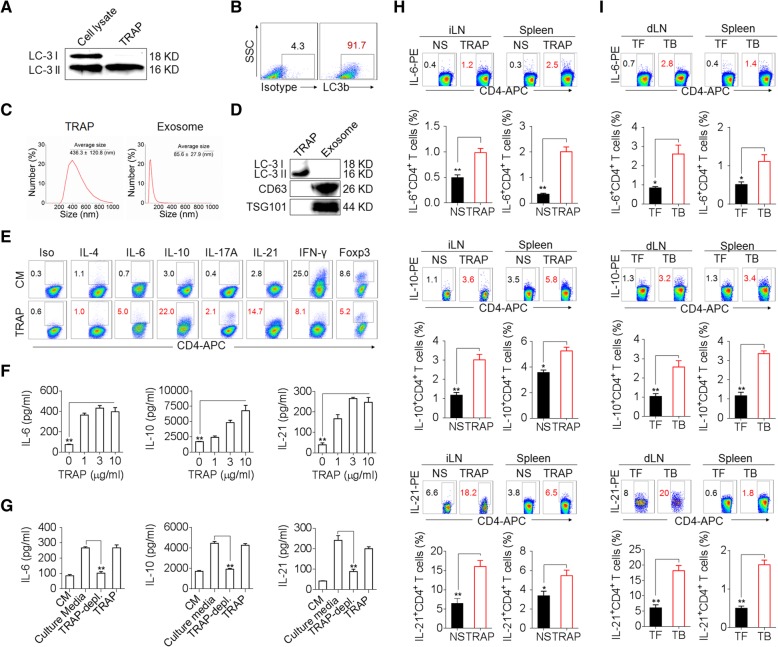
Fig. 1.
TRAPs induce IL-6, IL-10, and IL-21 expression by CD4+ T cells. a–d Characterization of TRAPs from B16F10 cells, including Western blot (a, d), flow cytometric (b), and dynamic light scattering (c) analyses of the expression of the autophagosome-specific marker LC-3II, the percentage, and the size distribution of the isolated TRAPs. e Flow cytometric determination of the percentage of IL-6-, IL-21-, IL-10-, IL-4-, IL-17-, IFN-γ-, and Foxp3-expressing CD4+ T cells treated with control media (CM) or 3 μg/ml TRAPs in the presence of anti-CD3 and anti-CD28 for 72 h. f ELISA of IL-6, IL-10, and IL-21 secretion by CD4+ T cells treated with CM or 1, 3, or 10 μg/ml TRAPs in the presence of anti-CD3 and anti-CD28 for 72 h. g ELISA of IL-6, IL-10 and IL-21 secretion by CD4+ T cells cultured in B16F10 tumor cell-conditioned culture media, TRAP-depleted tumor cell culture media or TRAPs purified from the equal cell culture media in the presence of anti-CD3 and anti-CD28 for 72 h. h Flow cytometric and statistical analyses of the percentage of IL-6+, IL-10+ or IL-21+ CD4+ T cells in the inguinal lymph nodes (iLN) and spleens of C57BL/6 mice (n = 6) 7 days after i.v. administration of normal saline (NS) or TRAPs (30 μg/mouse) every other day for 3 times. i Flow cytometric and statistical analyses of the percentage of IL-6+, IL-10+ or IL-21+ CD4+ T cells in the draining lymph nodes (dLN) and spleens of C57BL/6 tumor-bearing (TB) mice (n = 6) 21 days after s.c. inoculation of B16F10 cells, in comparison to the tumor-free (TF) mice. Data (mean ± SEM) represent 3 independent experiments. *, P < 0.05; **, P < 0.01; ***, P < 0.001; ns, not significant, by one-way ANOVA with the Tukey-Kramer multiple test, 2-tailed unpaired t-test or Mann-Whitney U test

