Fig. 3.
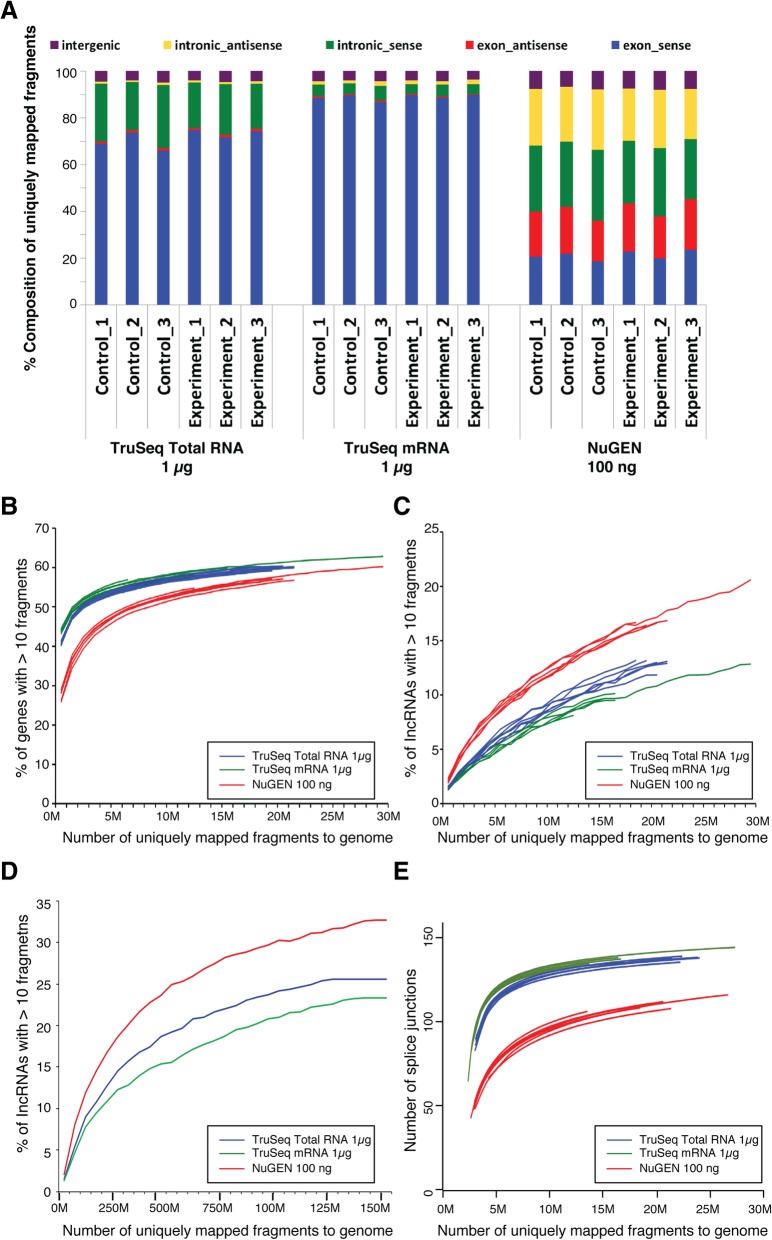
Representation of the transcriptome for all the libraries prepared with standard protocols. a Composition of the uniquely mapped fragments, shown as the percentage of fragments in exonic, intronic, and intergenic regions. According to the direction of transcription, exonic and intronic regions were further divided into sense and antisense. b Saturation analysis showing the percentage of coding genes recovered (calculated as the genes with more than 10 fragments) at increasing sequencing depth. c-d Saturation analysis showing the percentage of lncRNAs recovered (calculated as the lncRNAs with more than 10 fragments) at increasing sequencing depth. In C, the six libraries created using each of three protocols (18 libraries total) are plotted individually. In D, the six libraries from the same protocol were pooled. e Saturation analysis showing the number of splice junctions recovered at increasing sequencing depth

