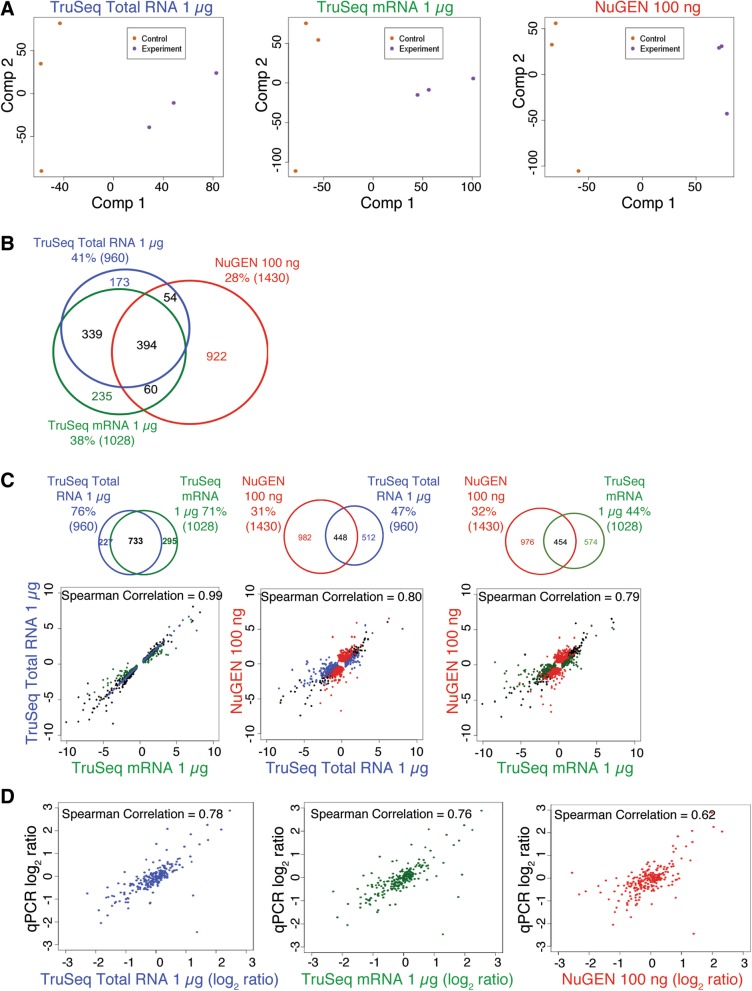
Fig. 5.
Concordance of differentially expressed genes (DEGs) recovered from libraries prepared with standard protocols. a Principle component analysis (PCA) was performed on the libraries prepared with each standard protocol. b Venn diagram showing the number of DEGs recovered with the three standard protocols. c Pairwise scatter plots of log2 ratio values comparing the DEGs identified in the tumor tissues of control and experimental mice. The black dots represent genes that were called as differentially expressed in libraries from both protocols, colored dots represent genes that were called as differentially expressed in the libraries from only one protocol. The Spearman’s rank correlation coefficient is shown at the top of each plot. The Venn diagram above each plot shows the number of DEGs recovered with the specified protocols. d Scatter plots of log2 ratio values calculated between tumor tissues of control and experimental mice for each protocol vs. qPCR. Spearman’s rank correlation coefficient is shown at the top of each plot

