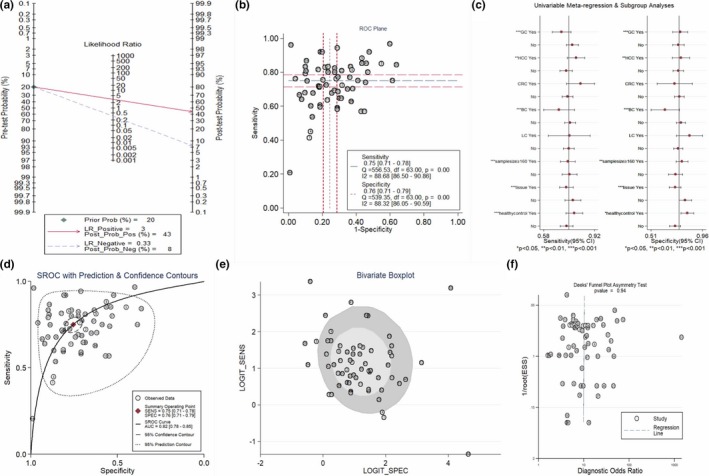
Figure 3.

Evaluation of the diagnostic accuracy of circRNA. (a) Fagan's nomogram, (b) ROC Plane, (c) Meta‐regression analysis, d SROC curve, (e) Bivariate boxplot, f Deeks’ funnel plot. circRNA, circular RNA; ROC, receiver operating characteristics; SROC, summary receiver operator characteristic
