
Figure 1.
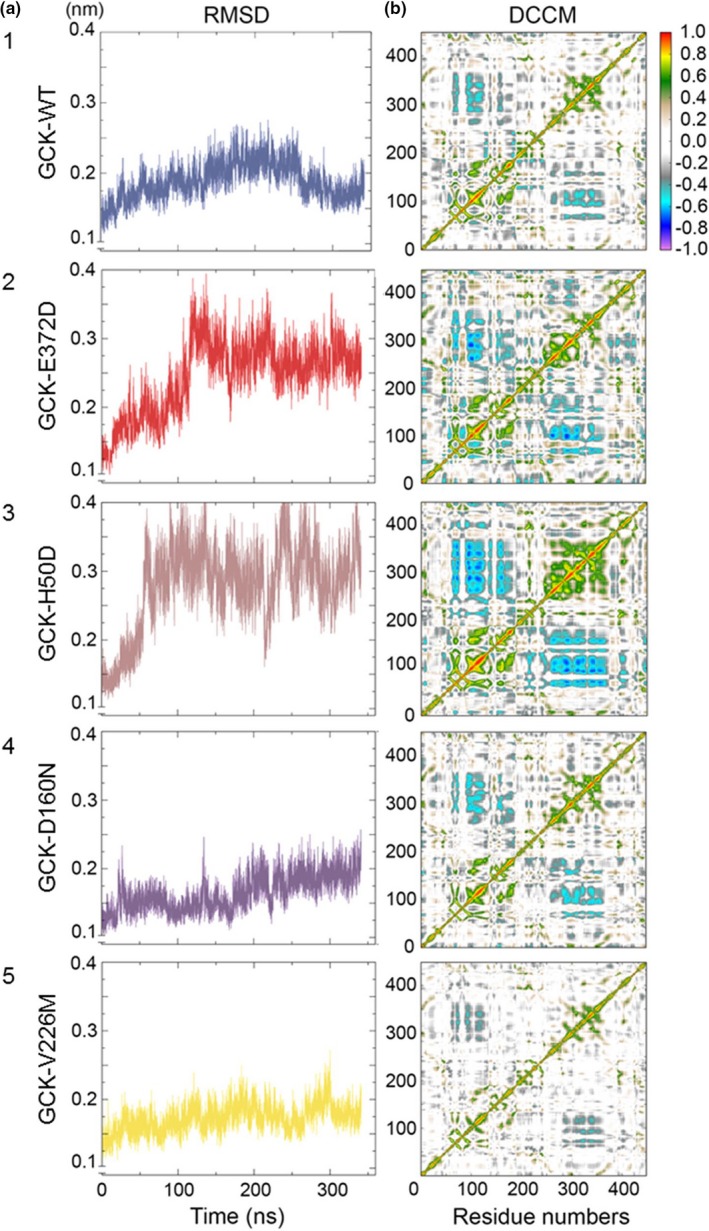
Molecular dynamics analysis. Panel a shows the backbone Root‐Mean‐Square‐Deviation (RMSD) of the native and mutant structures of the GCK protein. The blue, red, brown, violet, and yellow lines indicate the native GCK‐WT, the GCK‐E372D, the GCK‐H50D, the GCK‐D160N, and the GCK‐V226M mutant structures, respectively. Panel b shows the Dynamic‐Cross‐Correlation‐Maps (DCCMs); each matrix displays the long‐range interactions between the atoms forming the small and the large domain of GCK native and mutant proteins. Red to green peaks in the maps are indicative of strong to moderate positive correlation, dark to light blue peaks are indicative of strong to moderate anticorrelation between the indicated residue numbers