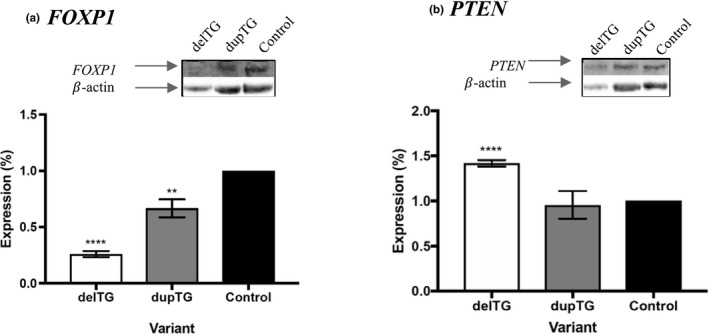
Figure 2.

FOXP1 Protein expression FOXP1 and PTEN protein quantification between individuals. delTG indicates Patient 1, dupTG indicates his father, and the control indicates his mother. (a) FOXP1 protein expression. (b) PTEN expression. In each case β‐actin was used as a loading control to normalize protein levels. Unpaired t test significance is denoted as p < 0.01(**) or p < 0.0001 (****) (n = 3, error = SD)
