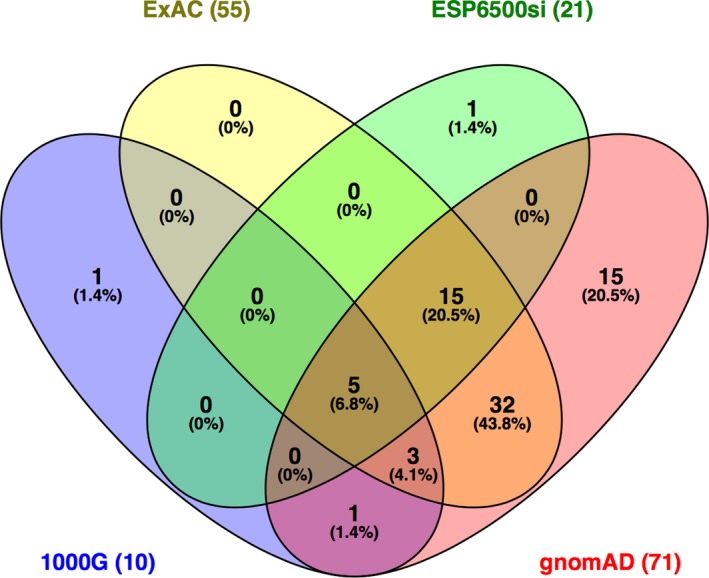
Figure 6.

Venn diagram showing the number of variants reported by four different databases (ExAC, ESP6500si, 1000G, gnomAD) through the wANNOVAR tool. The gnomAD database included the most variants compared to the three others. The diagram was produced with Venny 2.1 (http://bioinfogp.cnb.csic.es/tools/venny/index.html)
