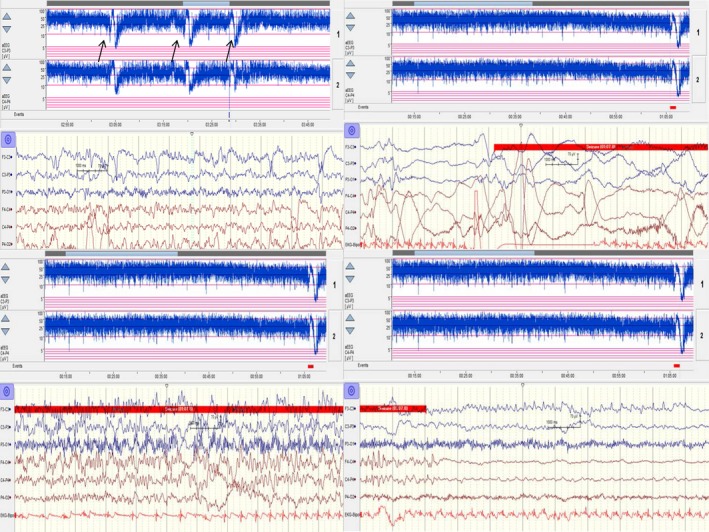
Figure 5.

Patient 6’s amplitude‐integrated EEG monitor showed many seizures (arrows) with unique low‐voltage fast activity arising from the left hemisphere followed by rhythmic theta and delta rhythms and postictal extremely low‐voltage activity during ictal recordings
