
FIGURE 3.
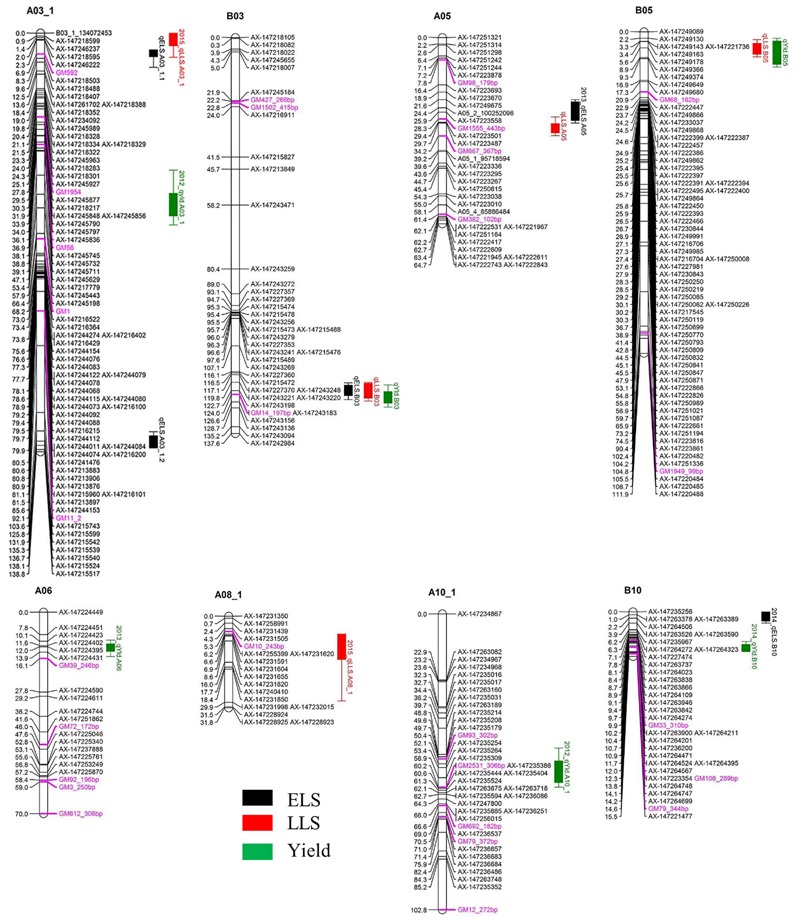
QTLs for early leaf spot (ELS), late leaf spot (LLS) disease resistance and yield detected in the Georgia-advanced RIL subpopulation. Map distance (cM) is shown to the left of each LG and genetic markers on the right. Traits without year suffix were identified by combined data analysis. Single year QTLs that overlapped with QTLs identified by combined data are not shown on the graph. SSR markers are indicated by purple font color.