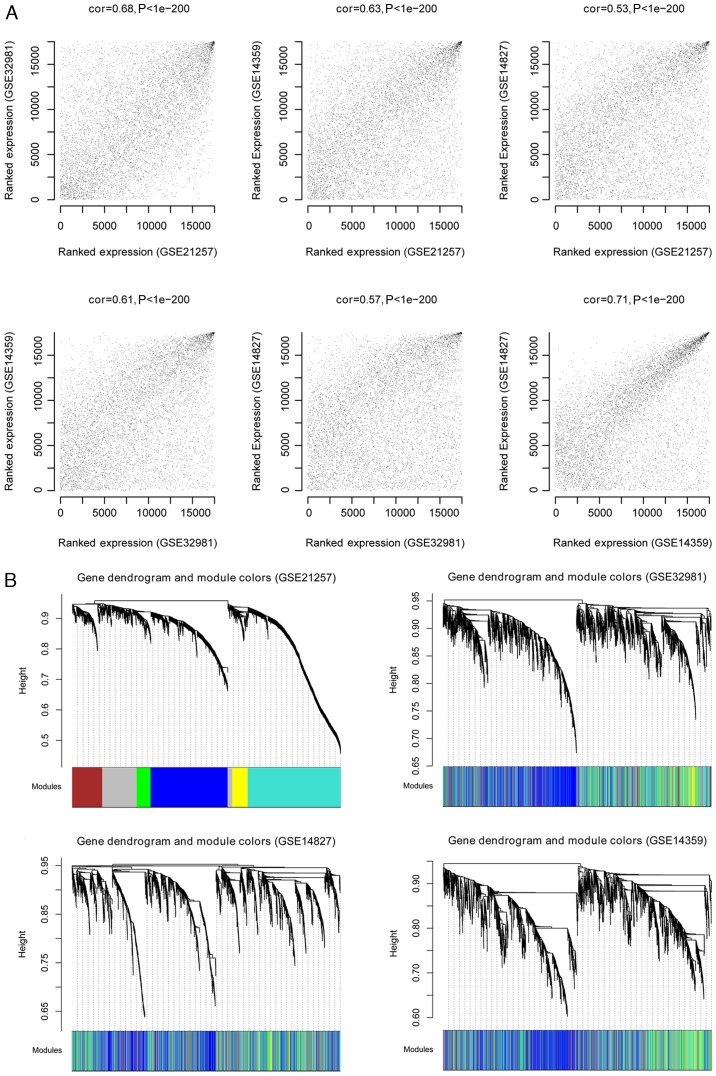
Figure 2.
Identification of stable gene modules associated with osteosarcoma as determined by weighted gene co-expression network analysis. (A) Correlation values between any two datasets from GSE21257, GSE32981, GSE14827 and GSE14359. The charts represent correlations between GSE21257-GSE32981, GSE21257-GSE14359, GSE21257-GSE14827, GSE32981-GSE14359, GSE32981-GSE14827 and GSE14359-GSE14827. (B) Cluster dendrogram based on the dynamic tree (GSE21257, GSE32981, GSE14827 and GSE14359). Different dendrogram colors represent various modules.

