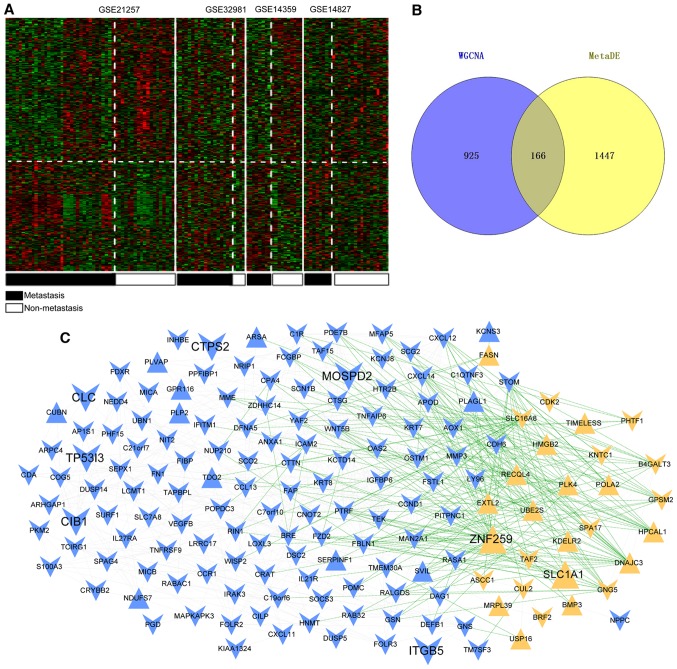
Figure 4.
DEG screening and gene co-expression network analysis. (A) Heat map for the significant DEGs. Black bars represent metastatic osteosarcoma samples and white bars represent non-metastatic osteosarcoma samples. (B) Venn diagram of key genes screened according to the WGCNA method and using the MetaDE package. (C) Co-expression network of overlapping genes. Blue and yellow represent the genes screened from blue and yellow modules, respectively. The equilateral and inverted triangles represent upregulated genes and downregulated genes; the green and gray lines represent negative and positive correlations, respectively. DEGs, differentially expressed genes; WGCNA, weighted gene co-expression network analysis.

