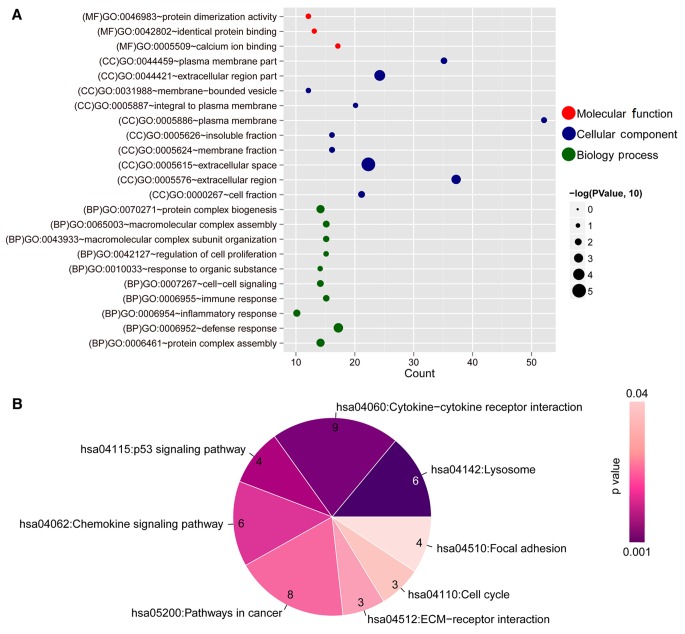
Figure 5.
Functional annotation of the key overlapping genes in the co-expression network. (A) GO annotation. The horizontal axis represents the number of genes and the vertical axis represents the name of the GO terms. The size of the dot represents a significant P-value; larger dots and lower P-values indicate a higher significance. (B) Kyoto Encyclopedia of Genes and Genomes pathway analysis for genes in the network. The color changes from purple to light pink represent changes in significance from high to low. The numbers in each component represent the number of genes involved in a pathway. GO, Gene Ontology.

