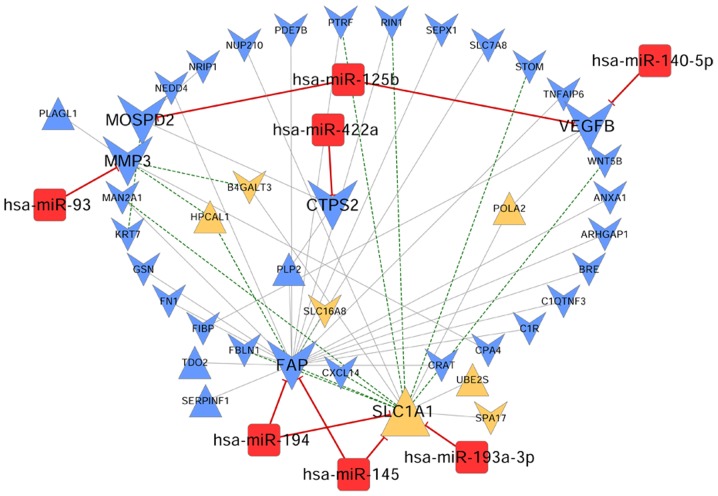
Figure 7.
miRNA-target gene network associated with osteosarcoma. Blue and yellow colors represent the genes screened from blue and yellow modules, respectively. The equilateral and inverted triangles represent upregulated and downregulated genes, respectively. The red squares refer to miRNAs associated with osteosarcoma. The green and gray lines represent the negative and positive connections. The red lines represent the interactions between miRNAs and target genes. miRNA/miR, microRNA.

