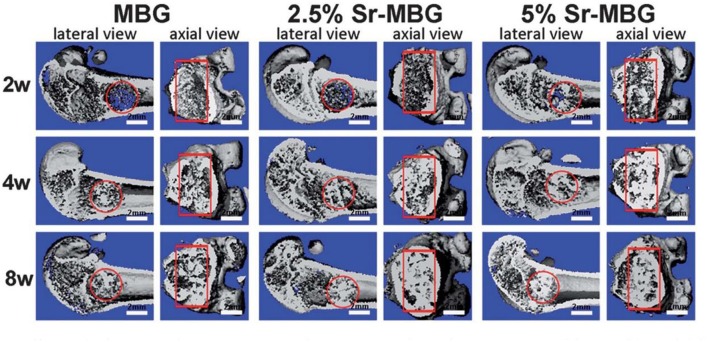
Figure 11.
Micro-CT images from implantation of MBGs doped with 2.5 and 5% Sr in the critical femoral defect of ovariectomized rats at two, four, and 8 weeks post-surgery. The red circle and rectangle show the boundary of the defected sites. As shown, a little new bone is present in the defects at 2 weeks, while abundant new bone is observed at the other time points (four and 8 weeks) which depicted visible difference among the groups. Scale bar 2 mm. Adapted from Zhang et al. (2013) with permission by The Royal Society.

