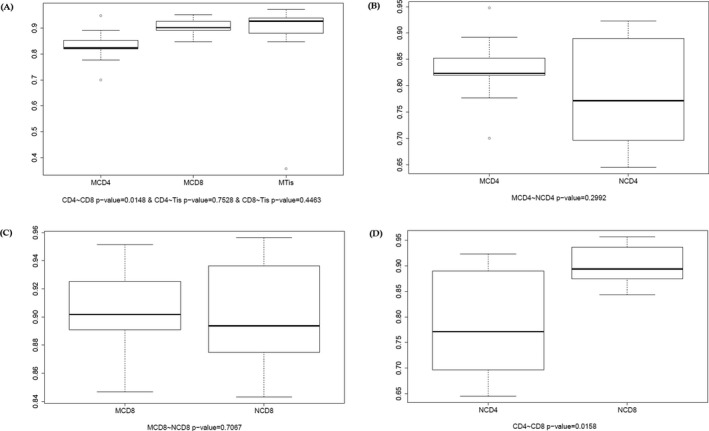
Figure 2.

Gini coefficient of patients and controls. (a) Comparison of CD4+ cell group, CD8+ cell group and tissue group of patients. (b) Comparison of CD4+ cell group in patients and CD4+ cell group in controls. (c) Comparison of CD8+ cell in patient group and CD8+ group in control. (d) Comparison of control CD8+ cell group and CD4+ cell group
