
Figure 4.
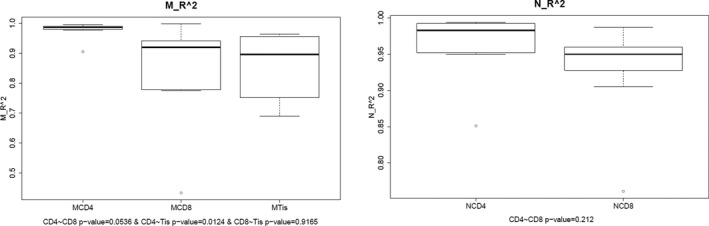
Gaussian distribution of R 2 value between groups. (a) Comparison among CD4+, CD8+ and tissue sample groups in patients. (b) Comparison among CD4+ and CD8+ cell groups in controls
Official websites use .gov
A
.gov website belongs to an official
government organization in the United States.
Secure .gov websites use HTTPS
A lock (
) or https:// means you've safely
connected to the .gov website. Share sensitive
information only on official, secure websites.
Gaussian distribution of R 2 value between groups. (a) Comparison among CD4+, CD8+ and tissue sample groups in patients. (b) Comparison among CD4+ and CD8+ cell groups in controls