
Figure 5.
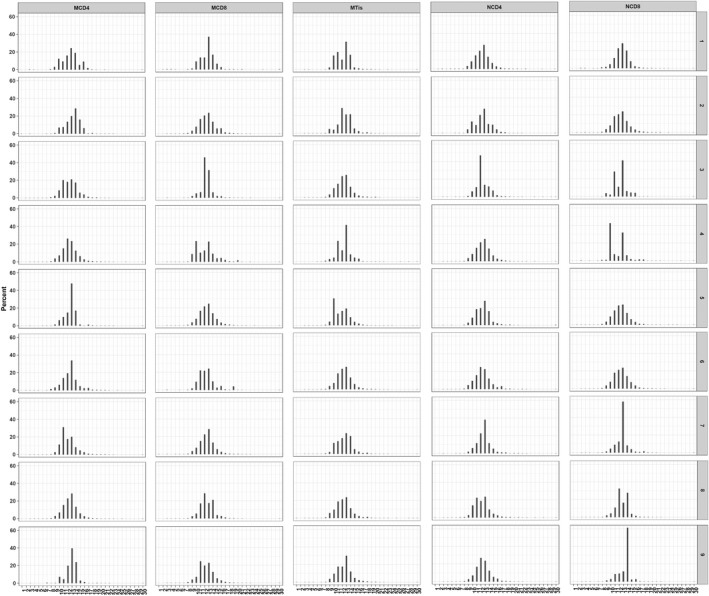
CDR3 length distribution in all samples. X‐axis represents length distribution, Y‐axis depicts the percentage of sequences of the corresponding length
Official websites use .gov
A
.gov website belongs to an official
government organization in the United States.
Secure .gov websites use HTTPS
A lock (
) or https:// means you've safely
connected to the .gov website. Share sensitive
information only on official, secure websites.
CDR3 length distribution in all samples. X‐axis represents length distribution, Y‐axis depicts the percentage of sequences of the corresponding length