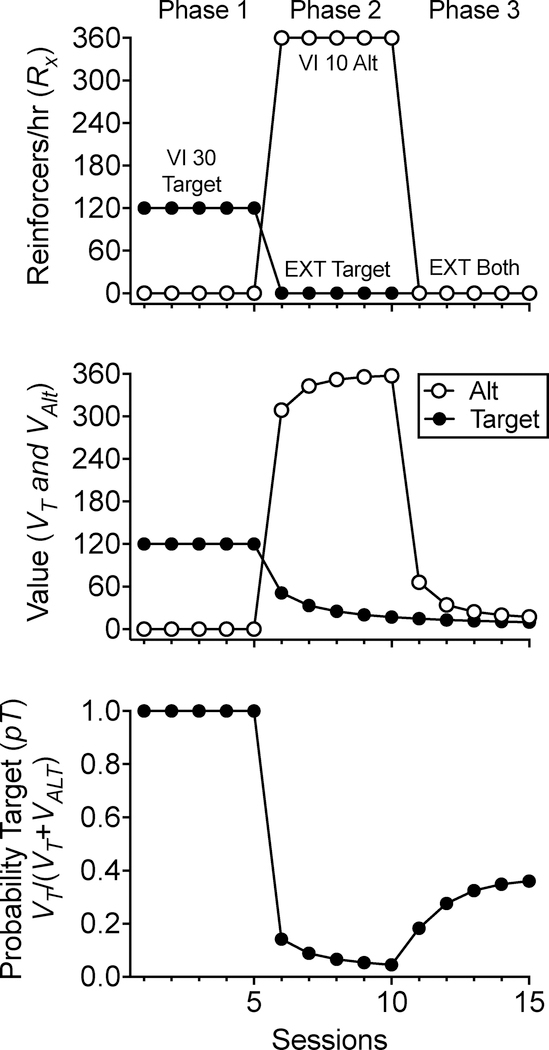
Figure 2.
Changes in value (middle panel) and response probability (bottom panel) as a function of changes in reinforcement rate (top panel) of target and alternative responding across three phases of a resurgence sequence. Increases in the probability of target responding when transitioning from Phase 2 to Phase 3 drive the resurgence effect.

