
Figure 6.
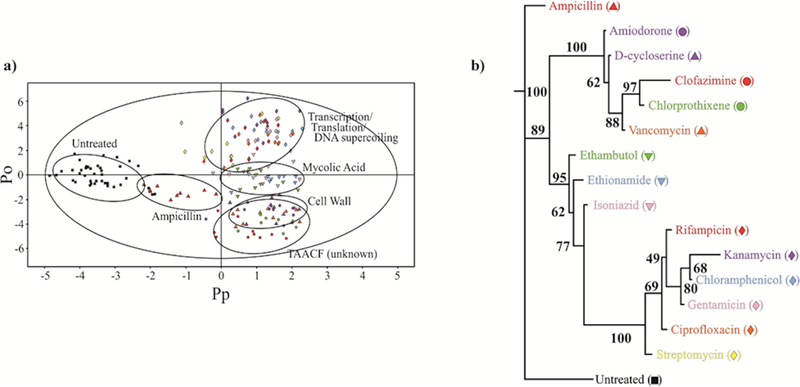
(a) 2D OPLS-DA scores plot demonstrating the clustering pattern for 12 antibiotics with known biological targets and three compounds of unknown in vivo activity: untreated M. smegmatis cells (black square), chloramphenicol (blue diamond), ciprofloxacin (orange diamond), gentamicin (pink diamond), kanamycin (lavender diamond), rifampicin (red diamond), streptomycin (yellow diamond), ethambutol (green down triangle), ethionamide (blue down triangle), isoniazid (pink down triangle), ampicillin (red up triangle), D-cycloserine (purple up triangle), vancomycin (orange up triangle), amiodorone (purple circle), chlorprothixene (green circle), and clofazimine (red circle) treated M. smegmatis cells. The ellipses correspond to the 95% confidence limits from a normal distribution for each cluster. The untreated M. smegmatis cells (black square) was designated the control class, and the remainder of the cells were designated as treated. The OPLS-DA used one predictive component and six orthogonal components to yield a R2X of 0.715, R2Y of 0.803, and Q2 of 0.671. (b) Metabolomics tree diagram determined from the OPLS-DA scores plot. The coloring scheme for each compound in the tree diagram correlates with the data point colors in the OPLS-DA scores plot. The bootstrap numbers for each node are indicated on the tree diagram. (Reprinted with permission from reference,[129] Copyright 2011 by American Chemical Society).