
Figure 8.
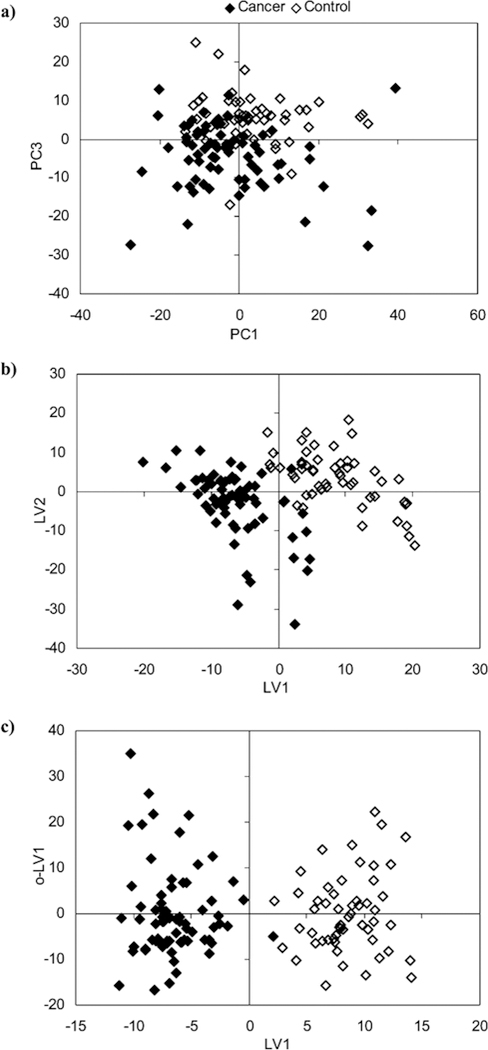
Scores scatter plots (a) PC1 vs PC3, (b) LV1 vs LV2, (c) LV1 vs o-LV1 resulting from applying, respectively, PCA, PLS-DA, and OPLS-DA to the 1H NMR spectra of urine (δ0.40 to 10.0, excluding 4.55−6.05) from healthy controls (open symbols) and lung cancer patients (full symbols). Reprinted with permission from reference,[130] (Copyright 2011 by American Chemical Society)