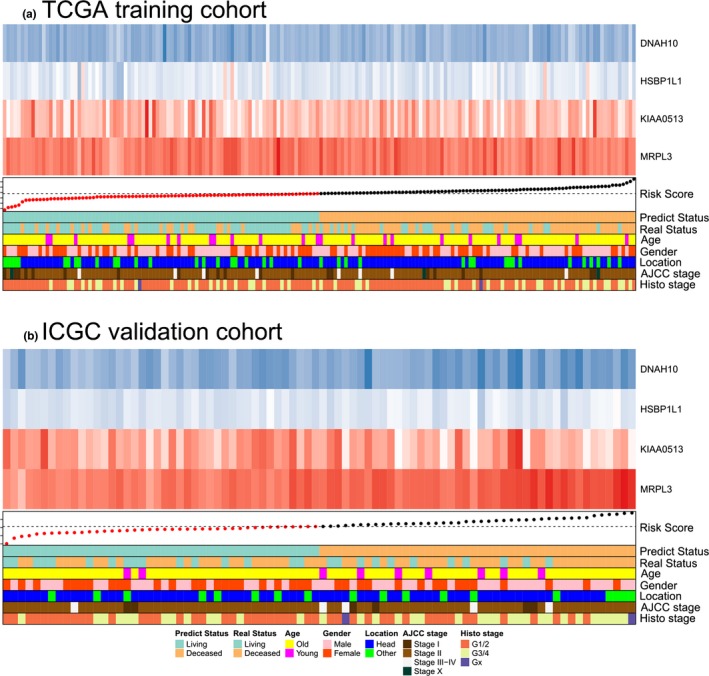
Figure 4.

Heatmap demonstrated the expression of the four predictive genes with distribution of risk‐score, age, gender, location, grade, and stage in TCGA cohort (a) and ICGC cohort (b). The blue box in the heatmap indicated the low expression, and red box indicated the high expression. Dashed line in the annotation indicated the median value of risk score. ICGC, International Cancer Genome Consortium; TCGA, The Cancer Genome Atlas
