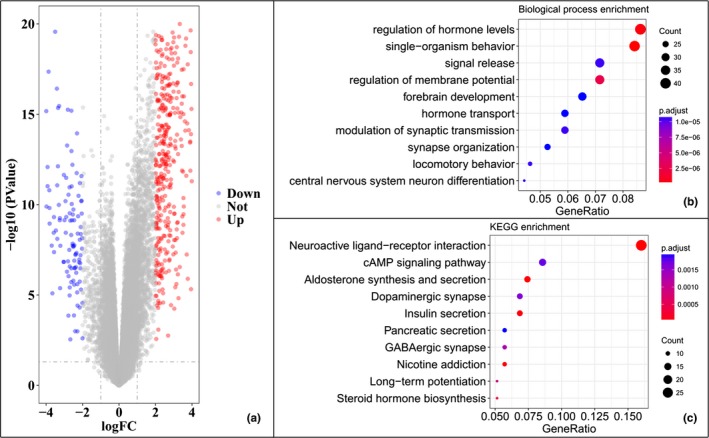
Figure 5.

Differential gene expression and gene functional enrichment analysis. The volcano plot shown the 579 DEG identified in TCGA cohort (a). The functional enrichment included biological process (b) and KEGG pathway (c). The top 10 items for two sets were shown. DEG, differential expression genes; TCGA, The Cancer Genome Atlas
