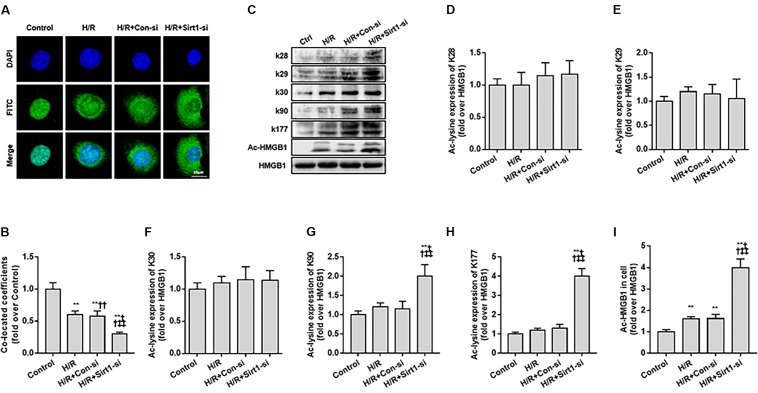
FIGURE 3.
Translocation of acety-HMGB1 from the nucleus to cytoplasm in HK-2 cells following hypoxia and re-oxygenation. (A) Expression and intracellular distribution of HMGB1 in HK-2 cells. The translocation of HMGB1 was observed by FITC labeling under a confocal microscope (original magnification × 630). (B) Co-located coefficients of HMGB1 and nucleus in HK-2 cells. (C) Levels of HMGB1 acetylated at different lysine residues in HK-2 cells. (D–I) Relative gray values of HMGB1 acetylated at different lysine residues in HK-2 cells. Compared with control + H/R group, ∗∗ denotes p < 0.01; compared with H/R + Con-si group, †† denotes p < 0.01; compared with H/R + Sirt1-si group, ‡‡ denotes p < 0.01; compared with SIRT1H363Y group, && denotes p < 0.01; n = 8. H/R, hypoxia/re-oxygenation.

