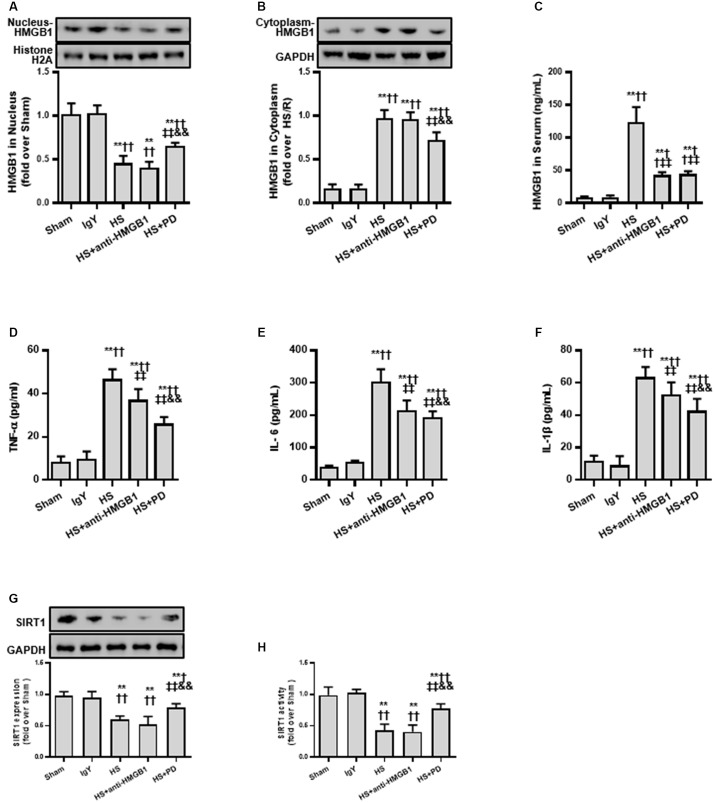
FIGURE 5.
Effects of HMGB1 inhibition and SIRT1 activation on HMGB1 and inflammatory cytokine levels in RTECs following HS. (A) Nucleus HMGB1 expression in RTEC nucleus following HS. (B) Cytoplasm HMGB1 expression in RTEC cytoplasm following HS. (C) HMGB1 serum levels following HS. (D–F) Pro-inflammatory cytokines (TNF-α, IL-6, and IL-1β) following HS. (G) SIRT1 protein expression in renal cells following HS. (H) SIRT1 activity in renal cells following HS. Compared with sham group, ∗∗ denotes p < 0.01; compared with IgY group, † denotes p < 0.05, †† denotes p < 0.01; compared with HS group, ‡‡ denotes p < 0.01; compared with HS + anti-HMGB1 group, && denotes p < 0.01. n = 8. HS, hemorrhagic shock; PD, polydatin; IgY, immunoglobulin Y.

