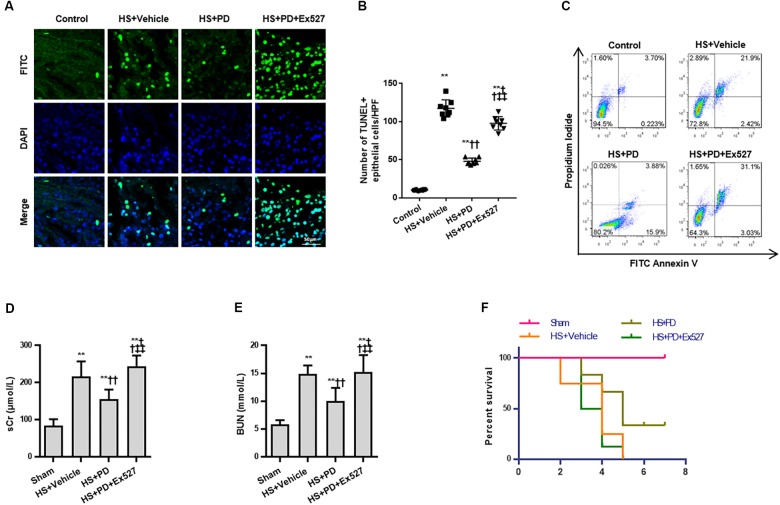
FIGURE 6.
Effects of SIRT1 activation on apoptosis, renal function and survival time of rats following HS. (A) HS-mediated RTEC apoptosis. The TUNEL positive cells were recognized as apoptotic cells in kidney tissue. (B) Statistical analysis of the TUNEL results. (C) Apoptosis determination of rat RTECs following HS. Apoptosis was reflected by annexin V positive ratio (%). (D,E) Renal function was reflected by serum Cr and BUN following HS. (F) Survival curve analysis of rats following HS. The median survival time was analyzed using Kaplan-Meier plots and compared using the log-rank test. Compared with sham group, ∗∗ denotes p < 0.01; compared with HS + Vehicle group, †† denotes p < 0.01; compared with HS + PD group, ‡‡ denotes p < 0.01; n = 8. HS, hemorrhagic shock; PD, polydatin; sCr, serum Cr; FITC, fluoresceine isothiocyanate; TUNEL, terminal deoxynucleotidyl transferase-mediated dUTP-biotin nick end labeling.

