Figure 5.

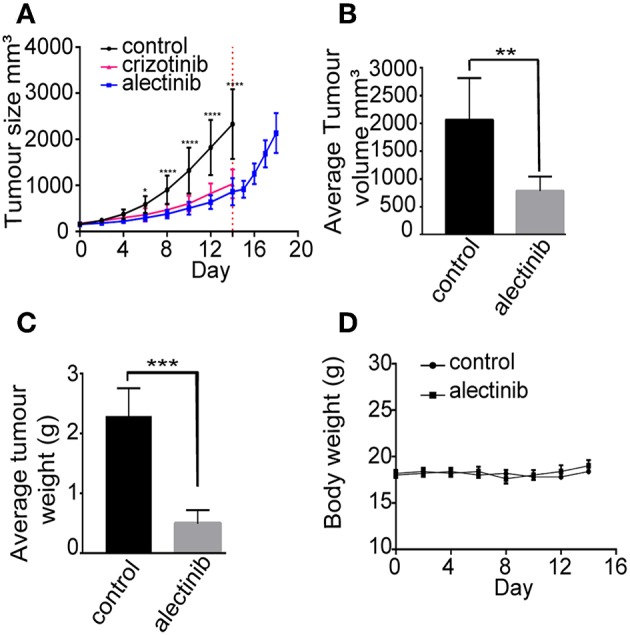
Alectinib inhibits tumor growth in a neuroblastoma xenograft model. 1 × 10⁶ CLB-BAR cells were injected subcutaneously in female BALB/cAnNRj-Foxn1nu mice. Mice were treated with vehicle control (n = 10), crizotinib (80 mg/kg once daily, n = 10) or alectinib (20 mg/kg once daily, n = 10) upon tumor growth. (A) Curves indicate tumor volume with vehicle control, crizotinib or alectinib treatment over 14 days. Red dotted line indicates the last day of treatment (day 14). The samples after red dotted line indicate the tumor growth after release from alectinib treatment (n = 5). Values were calculated with a two-way ANOVA, with Sidak's multiple comparison test employing GraphPad Prism 7.0, *p = 0.0222 and ****p < 0.0001. (B) Average tumor volume in either control or alectinib treated groups after 14 days (n = 5). (C) Average tumor weight in either control (n = 5) or alectinib treated groups after 14 days (n = 5). (D) Body weight of either control or alectinib treated mice during treatment. (B,C) values were calculated in GraphPad Prism 7.0, and are expressed as mean ± SD, P-values were calculated with an unpaired two-tailed Student t-test, ***p-value < 0.0001 (C) and **p-value = 0.0072 (B).
