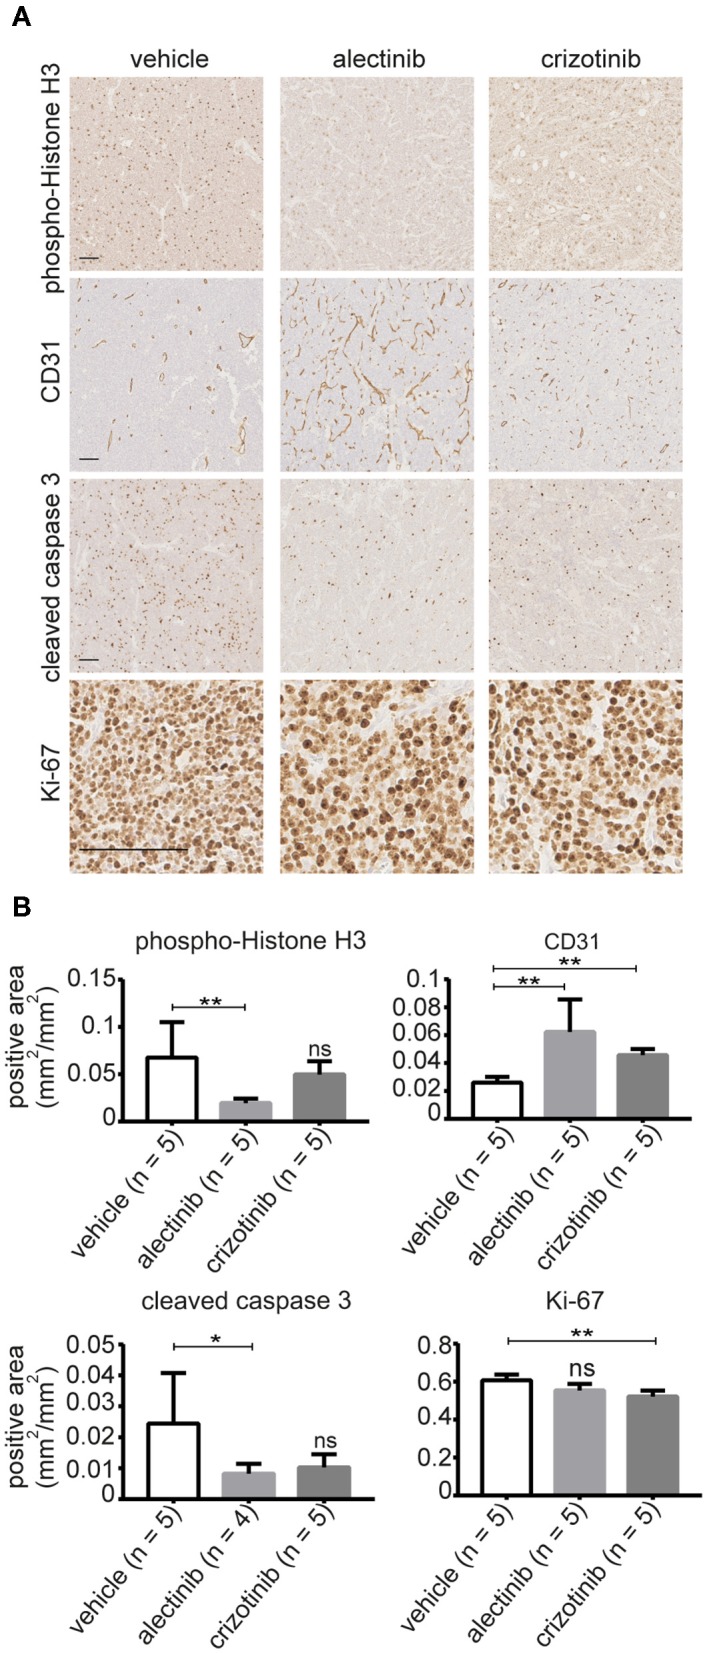
Figure 6.

(A) Representative images of tumors treated with either alectinib, crizotinib, or vehicle and stained with anti-Ki-67, anti-CD31, phosphor-Histone H3, and cleaved caspase 3. (B) Bar graphs show mean values ± SD; P-values were calculated by Mann-Whitney test, **p-value ≤ 0.008, *p-value < 0.05; ns, non-significant. Scale bars indicate 100 μm.
