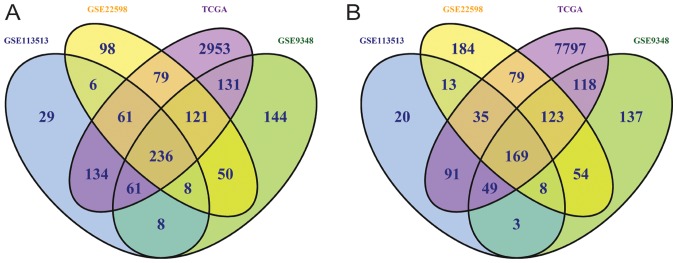
Figure 1.
Intersected analysis was used for the identification of 405 simultaneously changed DEGs from four datasets (GSE113513, GSE9348, GSE22598 and TCGA). (A) A total of 236 downregulated and (B) 169 upregulated overlapping DEGs was identified. Different colored regions represent different datasets, and the intersective area denotes the simultaneously changed DEGs. DEGs, differentially expressed genes; TCGA, The Cancer Genome Atlas.

