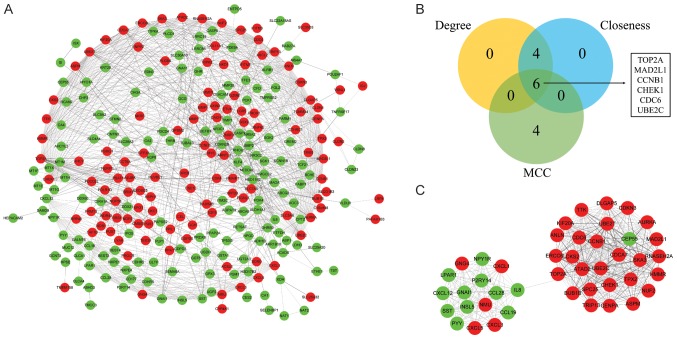
Figure 3.
PPI network and hub clustering modules. (A) PPI networks of the overlapping DEGs. (B) Hub genes were screened from the PPI network using the Closeness, Degree and MCC methods. (C) The top module was selected from the PPI network. Red circles indicate upregulated genes and green circles downregulated genes. PPI, protein-protein interaction; DEGs, differentially expressed genes.

