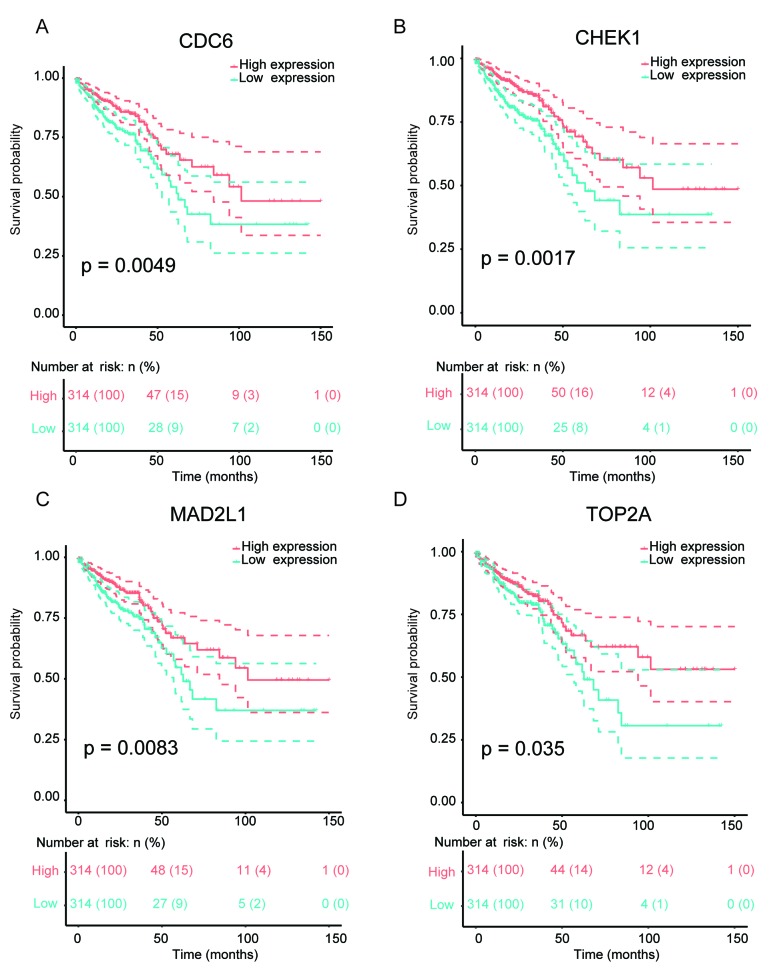
Figure 4.
Survival analysis showing the correlation between the expression of hub genes and overall survival in CRC patients. (A) CDC6, (B) CHEK1, (C) MAD2L1 and (D) TOP2A. Red lines represent high and green lines low expression genes. Dashed lines represent CI. The x-axis shows the survival time of CRC patients and the y-axis the survival probability. CRC, colorectal cancer; CDC6, Cell Division Cycle 6; CHEK1, Checkpoint Kinase 1; MAD2L1, Mitotic Arrest Deficient 2 Like 1; TOP2A, Topoisomerase II Alpha; CI, confidence interval.

