
Figure 2.

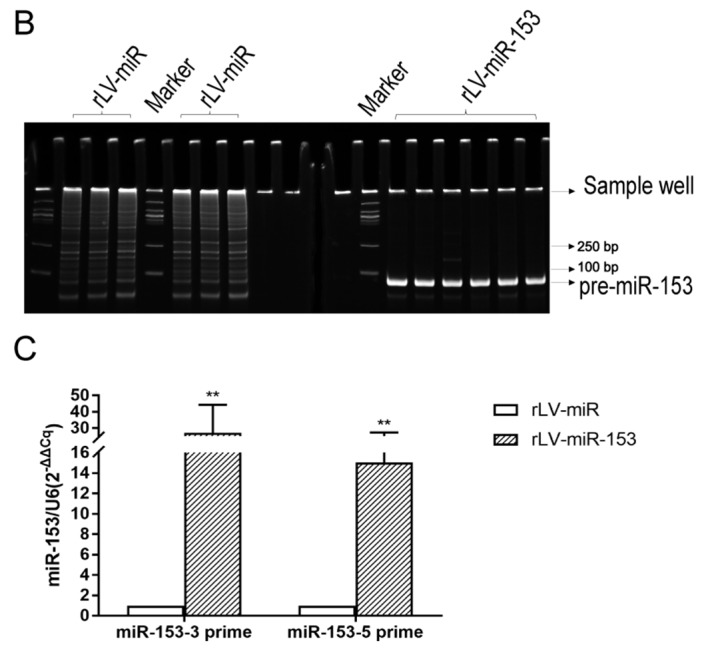
Identification of the overexpression of mmu miR-153 in HT-22 cells. (A) Selected monoclonal HT-22 cells after infection with the rLV-miR-153 virus and rLV-miR virus. The images are of living cells. Top row, observation under green fluorescent light; bottom row, observation under white light. Scale bar 400 µm. (B) Polymerase chain reaction (PCR) analysis of pre-miR-153 expression in monoclonal HT-22 cells infected by rLV-miR and rLV-miR-153. The products were subjected to PAGE. The arrow indicates mmu pre-miR-153 band (69 bp). (C) qPCR analysis of mature mmu miR-153 expression in selected monoclonal HT-22 cells. The relative expression of mature mmu miR-153-3 prime (MIMAT0000163) and mmu miR-153-5 prime (MIMAT0016992) is shown. Relative expression was calculated using the relative cycle quantification method (2−ΔΔCq) and normalized to U6. Significance was determined by comparing rLV-miR-153 to rLV-miR control with two-tailed paired t-test. Error bars represent standard deviation. **P<0.01.