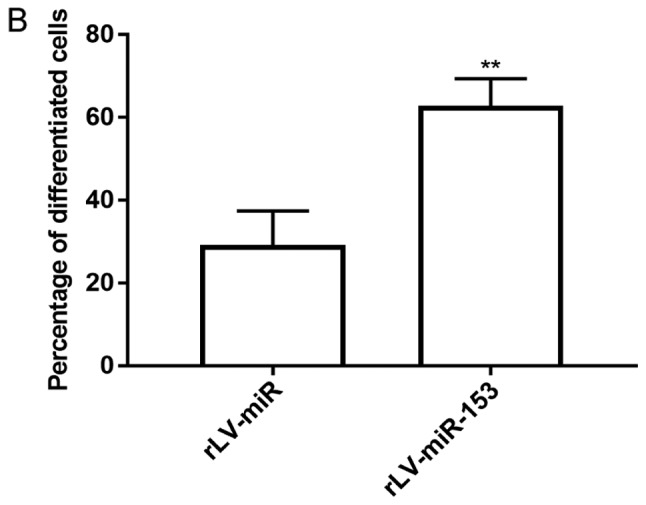
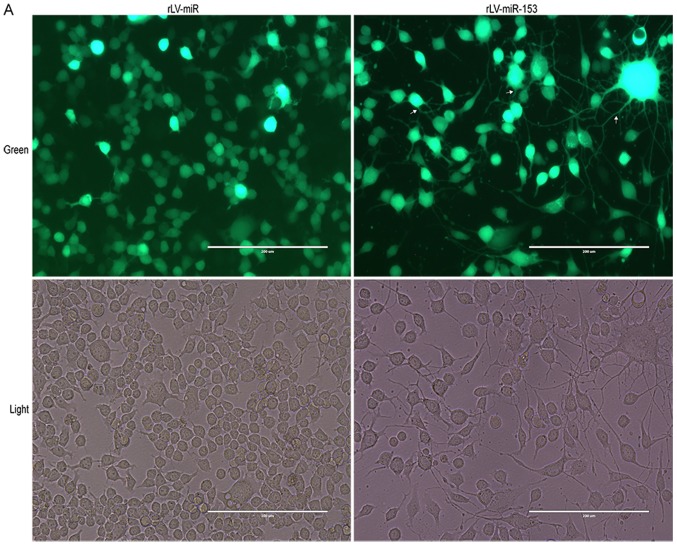
Figure 3.

Morphology of HT-22 cells after rLV-miR-153 overexpression. (A) Green, green fluorescent protein (GFP) in infected HT-22 cells. Light, observation under white light. Cells with protrusions were identified as differentiated cells (arrows). Scale bar 200 µm. The images are of live cells. (B) Significance was determined by comparing rLV-miR-153 overexpression to control cells with two-tailed unpaired t-test; n=5. Error bars represent standard deviation. **P<0.01. As indicated by the arrows in A, cells with protrusions and branches were identified as positive and counted. Five visual fields per cell group were examined and the positive percentage of cells among GFP-positive cells was calculated. The difference was found to be statistically significant.

