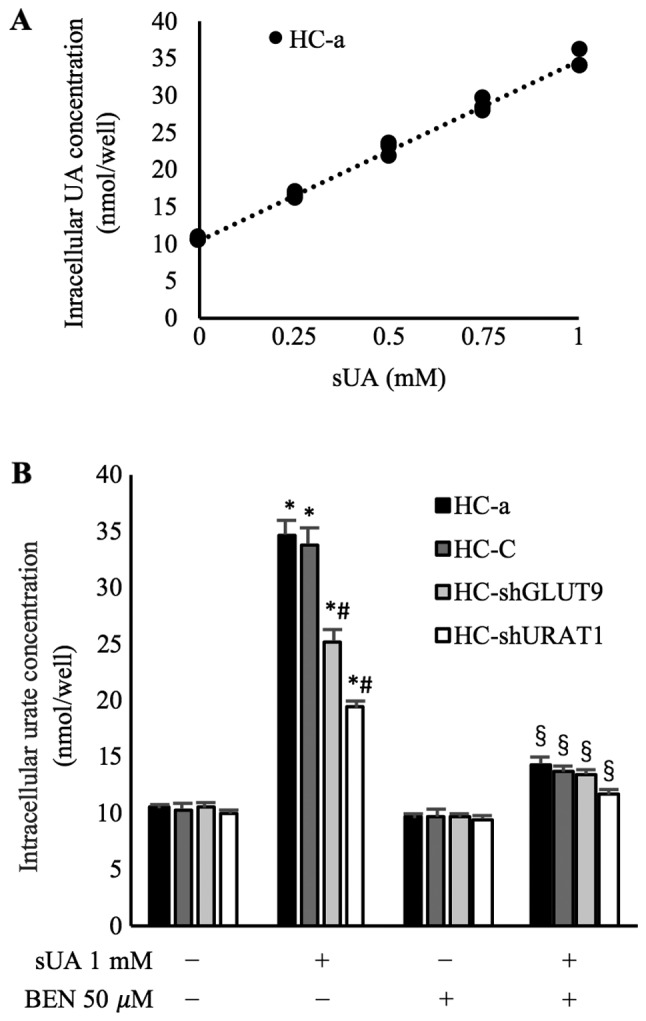
Figure 4.

UA transport assay of GLUT9 and URAT1 in chondrocytes. (A) HC-a cells displayed a concentration-dependent increase in intracellular UA concentrations following incubation with exogenous sUA (R2=0.9932). (B) Intracellular UA concentrations in cells following incubation with sUA (1 mM) with or without BEN (50 µM) pretreatment. Data were presented as the mean ± standard deviation (n=3). *P<0.05 vs. Control; #P<0.05 vs. HC-a cells under the same incubation conditions; §P<0.05 vs. sUA. GLUT9, glucose transporter 9; URAT1, urate transporter 1; sh, short hairpin RNA; HC-shGLUT9, HC-a cells with GLUT9 knockdown; HC-shURAT1, HC-a cells with URAT1 knockdown; HC-sc, HC-a cells transduced with scrambled RNA; BEN, benzbromarone; (s)UA, (soluble) uric acid.
