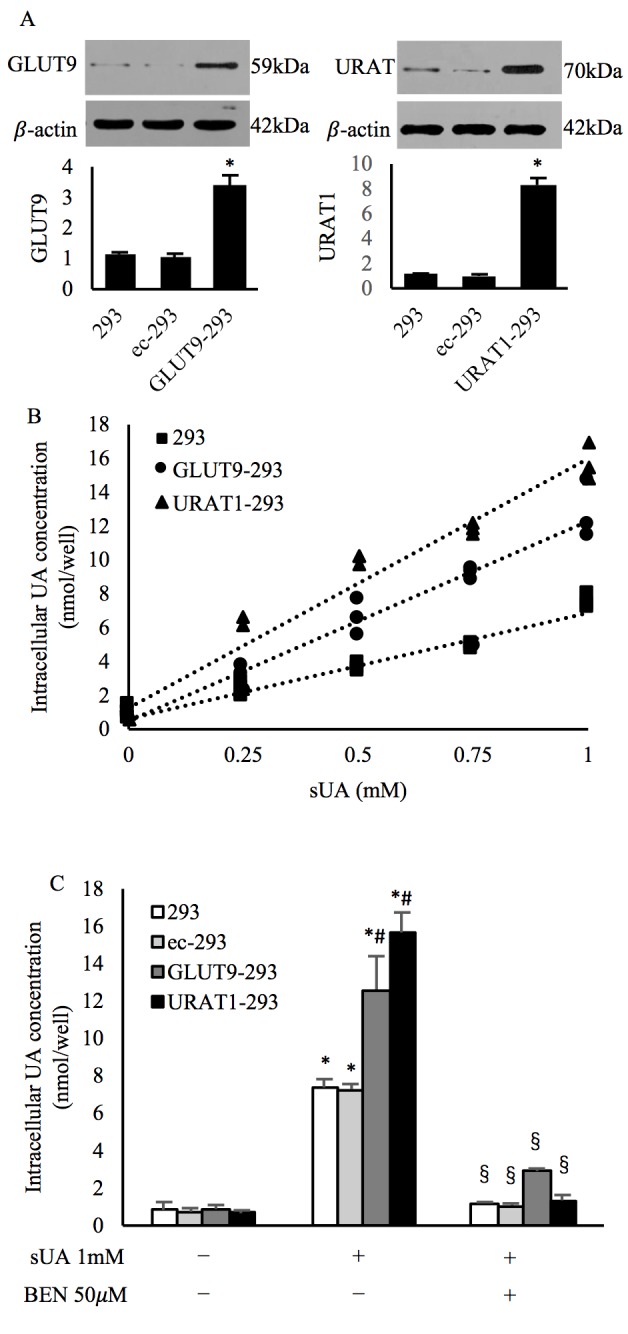
Figure 5.

Expression and UA transport assay in 293 cells. (A) Western blot analysis demonstrating overexpression of GLUT9 and URAT1 in transduced 293 cells. *P<0.05 vs. 293. (B) Concentration-dependent increases in intracellular UA concentrations in 293, GLUT9-293 and URAT1-293 cells. (C) Intracellular UA concentrations in cells following incubation with sUA (1 mM) with or without BEN (50 µM) pretreatment. Transduction with empty vector did not influence protein expression or transport function. Data were presented as the mean ± standard deviation (n=3). *P<0.05 vs. Control; #P<0.05 vs. HC-a cells under the same incubation conditions; §P<0.05 vs. sUA. GLUT9, glucose transporter 9; URAT1, urate transporter 1; GLUT9-293, 293 cells overexpressing GLUT9; URAT1-293, 293 cells overexpressing URAT1; BEN, benzbromarone; (s)UA, (soluble) uric acid.
