Figure 1.
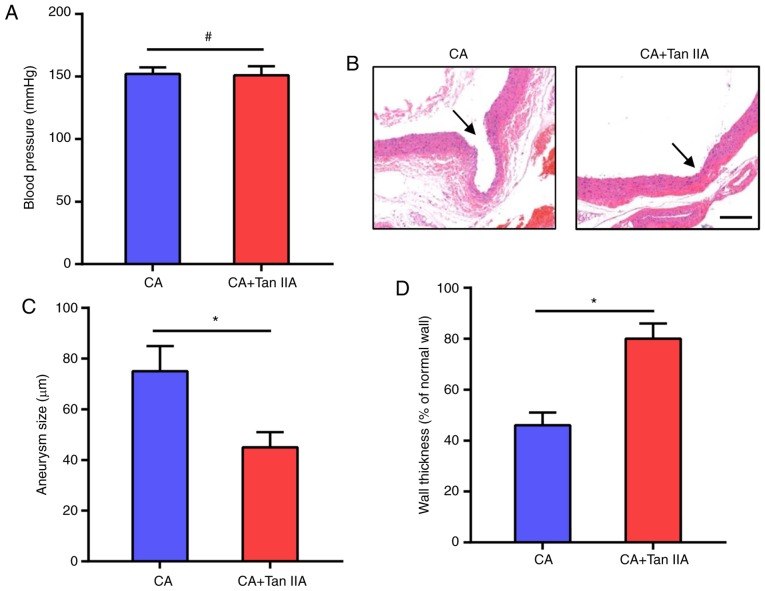
Tan IIA suppresses CA formation in rats. (A) Blood pressure was monitored following CA induction. No significant difference was observed between the CA and CA+Tan IIA group. Data are presented as the mean ± standard deviation (n=6/group). #P>0.05. (B) Verhoeff-Van Gieson staining of the vascular wall. Arrows indicate the luminal sides of CAs. Scale bar, 30 µm. (C) Measurement of aneurysm size. (D) Wall thickness ratio. Results are presented as the mean ± standard deviation (n=6/group). *P<0.05 vs. the CA group. Tan IIA, tanshinone IIA; CA, cerebral aneurysm.

