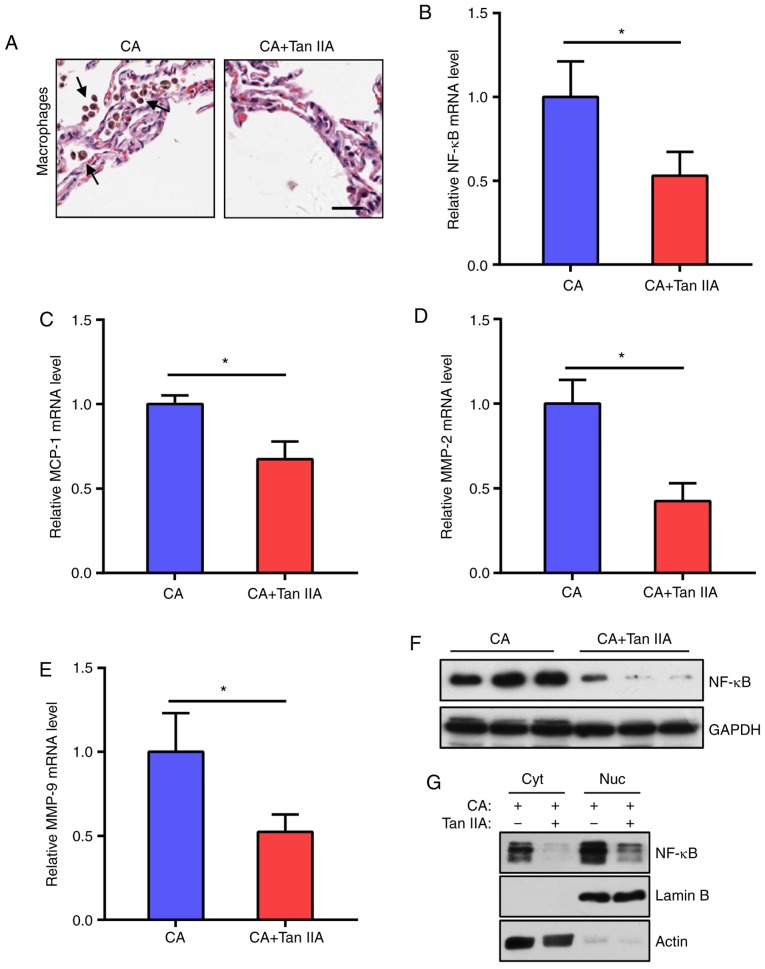
Figure 2.
Tan IIA reduces the inflammatory response in aneurysmal walls. (A) Representative images of H&E staining of aneurysmal walls. Arrows indicate macrophages. Scale bar, 10 µm. (B-E) RT-qPCR analysis of mRNA expression levels of NF-κB (B) MCP-1 (C) MMP-2 (D) and MMP-9 (E) normalized to GAPDH in the CA and CA+Tan IIA groups. Data are presented as the mean ± standard deviation (n=6/group), *P<0.05 vs. the CA group. (F) Western blot analysis of NF-κB expression levels in the aneurysmal walls of the CA and CA+Tan IIA groups (n=3/group). GAPDH served as the loading control. (G) Western blot analysis of NF-κB distribution in aneurysmal walls of the CA and CA+Tan IIA groups. Cyt, cytoplasm, Nuc, nucleus. Lamin B served as the loading control of the nucleus. Actin served as the loading control of the cytoplasm. Tan IIA, tanshinone IIA; CA, cerebral aneurysm; RT-qPCR, reverse transcription quantitative polymerase chain reaction; NF-κB, nuclear factor-κB; MMP, matrix metalloproteinase.

