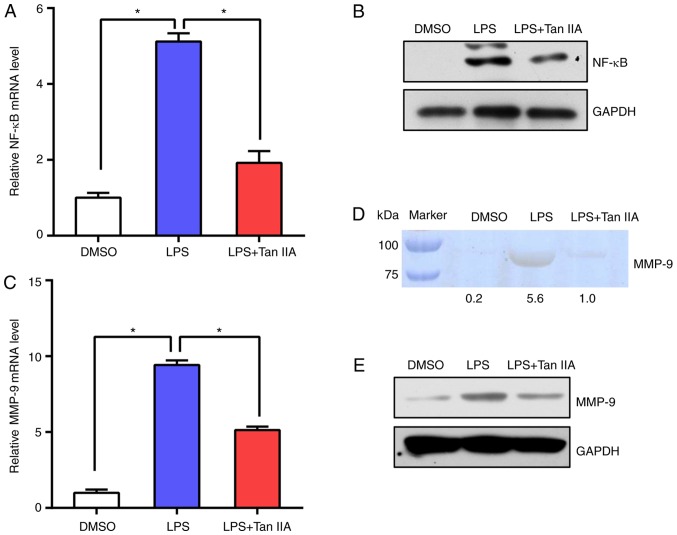
Figure 5.
Tan IIA reduces NF-κB and MMP-9 expression in LPS-stimulated RAW 264.7 cells. (A) RT-qPCR analysis of mRNA expression levels of NF-κB in DMSO, LPS or LPS+Tan IIA-treated RAW 264.7 cells. Results are presented as the mean ± standard deviation. *P<0.05 vs. the indicated control. (B) Western blot analysis of NF-κB protein levels in DMSO, LPS or LPS+Tan IIA-treated RAW 264.7 cells. (C) RT-qPCR analysis of mRNA expression levels of MMP-9 in DMSO, LPS or LPS+Tan IIA-treated RAW 264.7 cells. Results are presented as the mean ± standard deviation. *P<0.05 vs. the indicated control. (D) MMP-9 activity from each cell group was measured by gelatin zymography assay. Relative gray values of each band were calculated and are shown below the blot. (E) Western blot analysis of MMP-9 protein levels in DMSO, LPS or LPS+Tan IIA-treated RAW 264.7 cells. Tan IIA, tanshinone IIA; LPS, lipopolysaccharide; NF-κB, nuclear factor-κB; MMP, matrix metalloproteinase; RT-qPCR, reverse transcription quantitative polymerase chain reaction.

