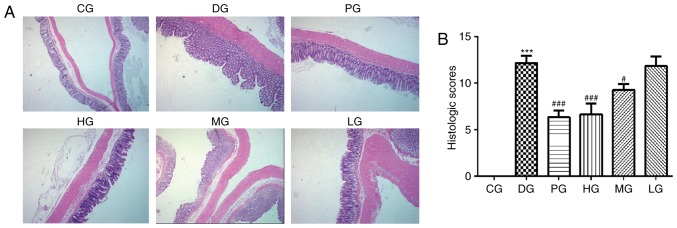
Figure 3.
Effects of ART on the pathological alterations in the colon. (A) Representative images of hematoxylin and eosin stained sections (magnification, ×200), and (B) quantification of the pathological alterations in the colon according to the histological score. ***P<0.001 vs. CG; #P<0.05 and ###P<0.001, vs. DG. ART, artesunate; CG, control group; DG, dextran sulfate sodium-treated model group; LG, low-dose ART group; MG, middle-dose ART group; HG, high-dose ART group; PG, positive control group.

