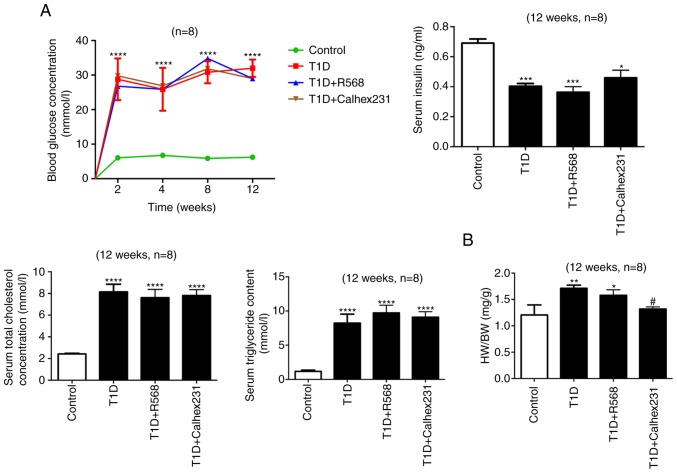
Figure 1.
Successful modeling of type 1 diabetic cardiomyopathy. (A) Random blood glucose was assessed at weeks 2, 4, 8 and 12. Other indicators were analyzed at week 12 after successful modeling. Blood glucose, TG, TC and insulin levels in the serum. (B) HW/BW. *P<0.05, **P<0.01, ***P<0.001, ****P<0.0001 vs. the Control; #P<0.05 vs. T1D rats (n=8). TG, triacylglycerol; TC, total cholesterol; HW/BW, heart weight to body weight ratio; T1D, type 1 diabetes.

