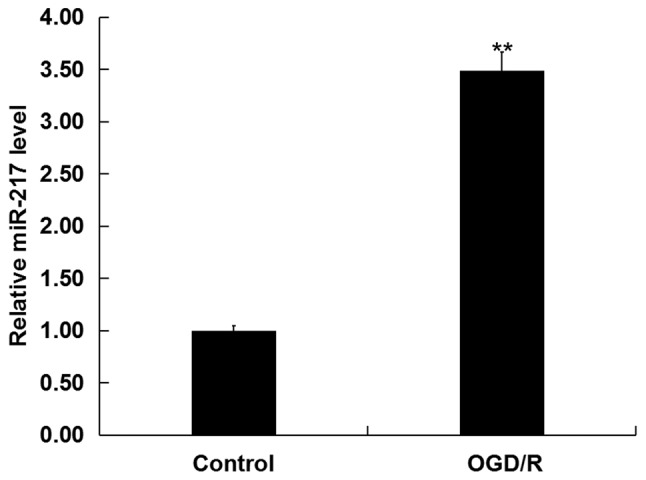
Figure 1.

miR-217 expression in OGD/R-treated neurons. miR-217 expression levels in neurons following OGD/R treatment were detected by reverse transcription-quantitative PCR analysis. Data are presented as the mean ± standard deviation. **P<0.01 vs. control. miR-217, microRNA-217; OGD/R, oxygen-glucose deprivation and reoxygenation.
