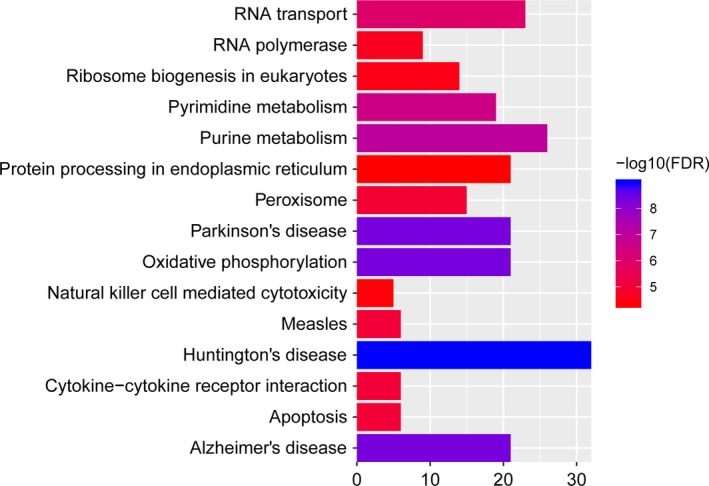
Figure 3.

Top 15 significantly enriched pathways of DEGs in IS compared to normal control. The x‐axis shows −log FDR and y‐axis shows KEGG pathways. DEGs, differentially expressed genes; FDR, false discovery rate; IS, ischemic stroke; KEGG, Kyoto Encyclopedia of Genes and Genomes
